
The Economics of Restoration
We understand Xactimate pricing, insurance adjusters, and the urgency-driven economics of emergency response.
Job Values & Margins
| Job Type / Metric | Typical Value |
|---|---|
| Water Mitigation | $2,500 - $5,000 |
| Mold Remediation | $3,000 - $10,000 |
| Fire Restoration | $40,000 - $200,000+ |
| Reconstruction | $10,000 - $50,000 |
| Mitigation Margin | 70% - 85% |
| Reconstruction Margin | 20% - 40% |
| Net Profit Target | 15% - 20% |
Acquisition Funnel Targets
| Metric | Target |
|---|---|
| Cost Per Click (PPC) | $50 - $100 |
| Cost Per Exclusive Lead | $250 - $500 |
| Cost Per Booked Job | $750 - $1,000 |
| First Responder Win Rate | ~70% |
| Speed-to-Site Target | <60 minutes |
Speed Wins Everything: In restoration, the first responder wins the job approximately 70% of the time. Once your crew is on-site, you typically secure the entire scope—mitigation AND reconstruction.
Critical Success Factor: 24/7 phone coverage is non-negotiable. If you don't answer in 5 minutes, the homeowner calls the next contractor. Our systems are built around speed-to-lead measured in seconds, not minutes.
Restoration Projection Engine
Model your job volume based on lead costs, answer rates, and dispatch conversion. All figures are targets based on industry benchmarks.
* All projections are targets based on industry benchmarks. Individual results vary based on market conditions, crew capacity, 24/7 coverage, and speed-to-site capability.
From Emergency to Invoice
A speed-focused funnel designed for emergency response businesses.
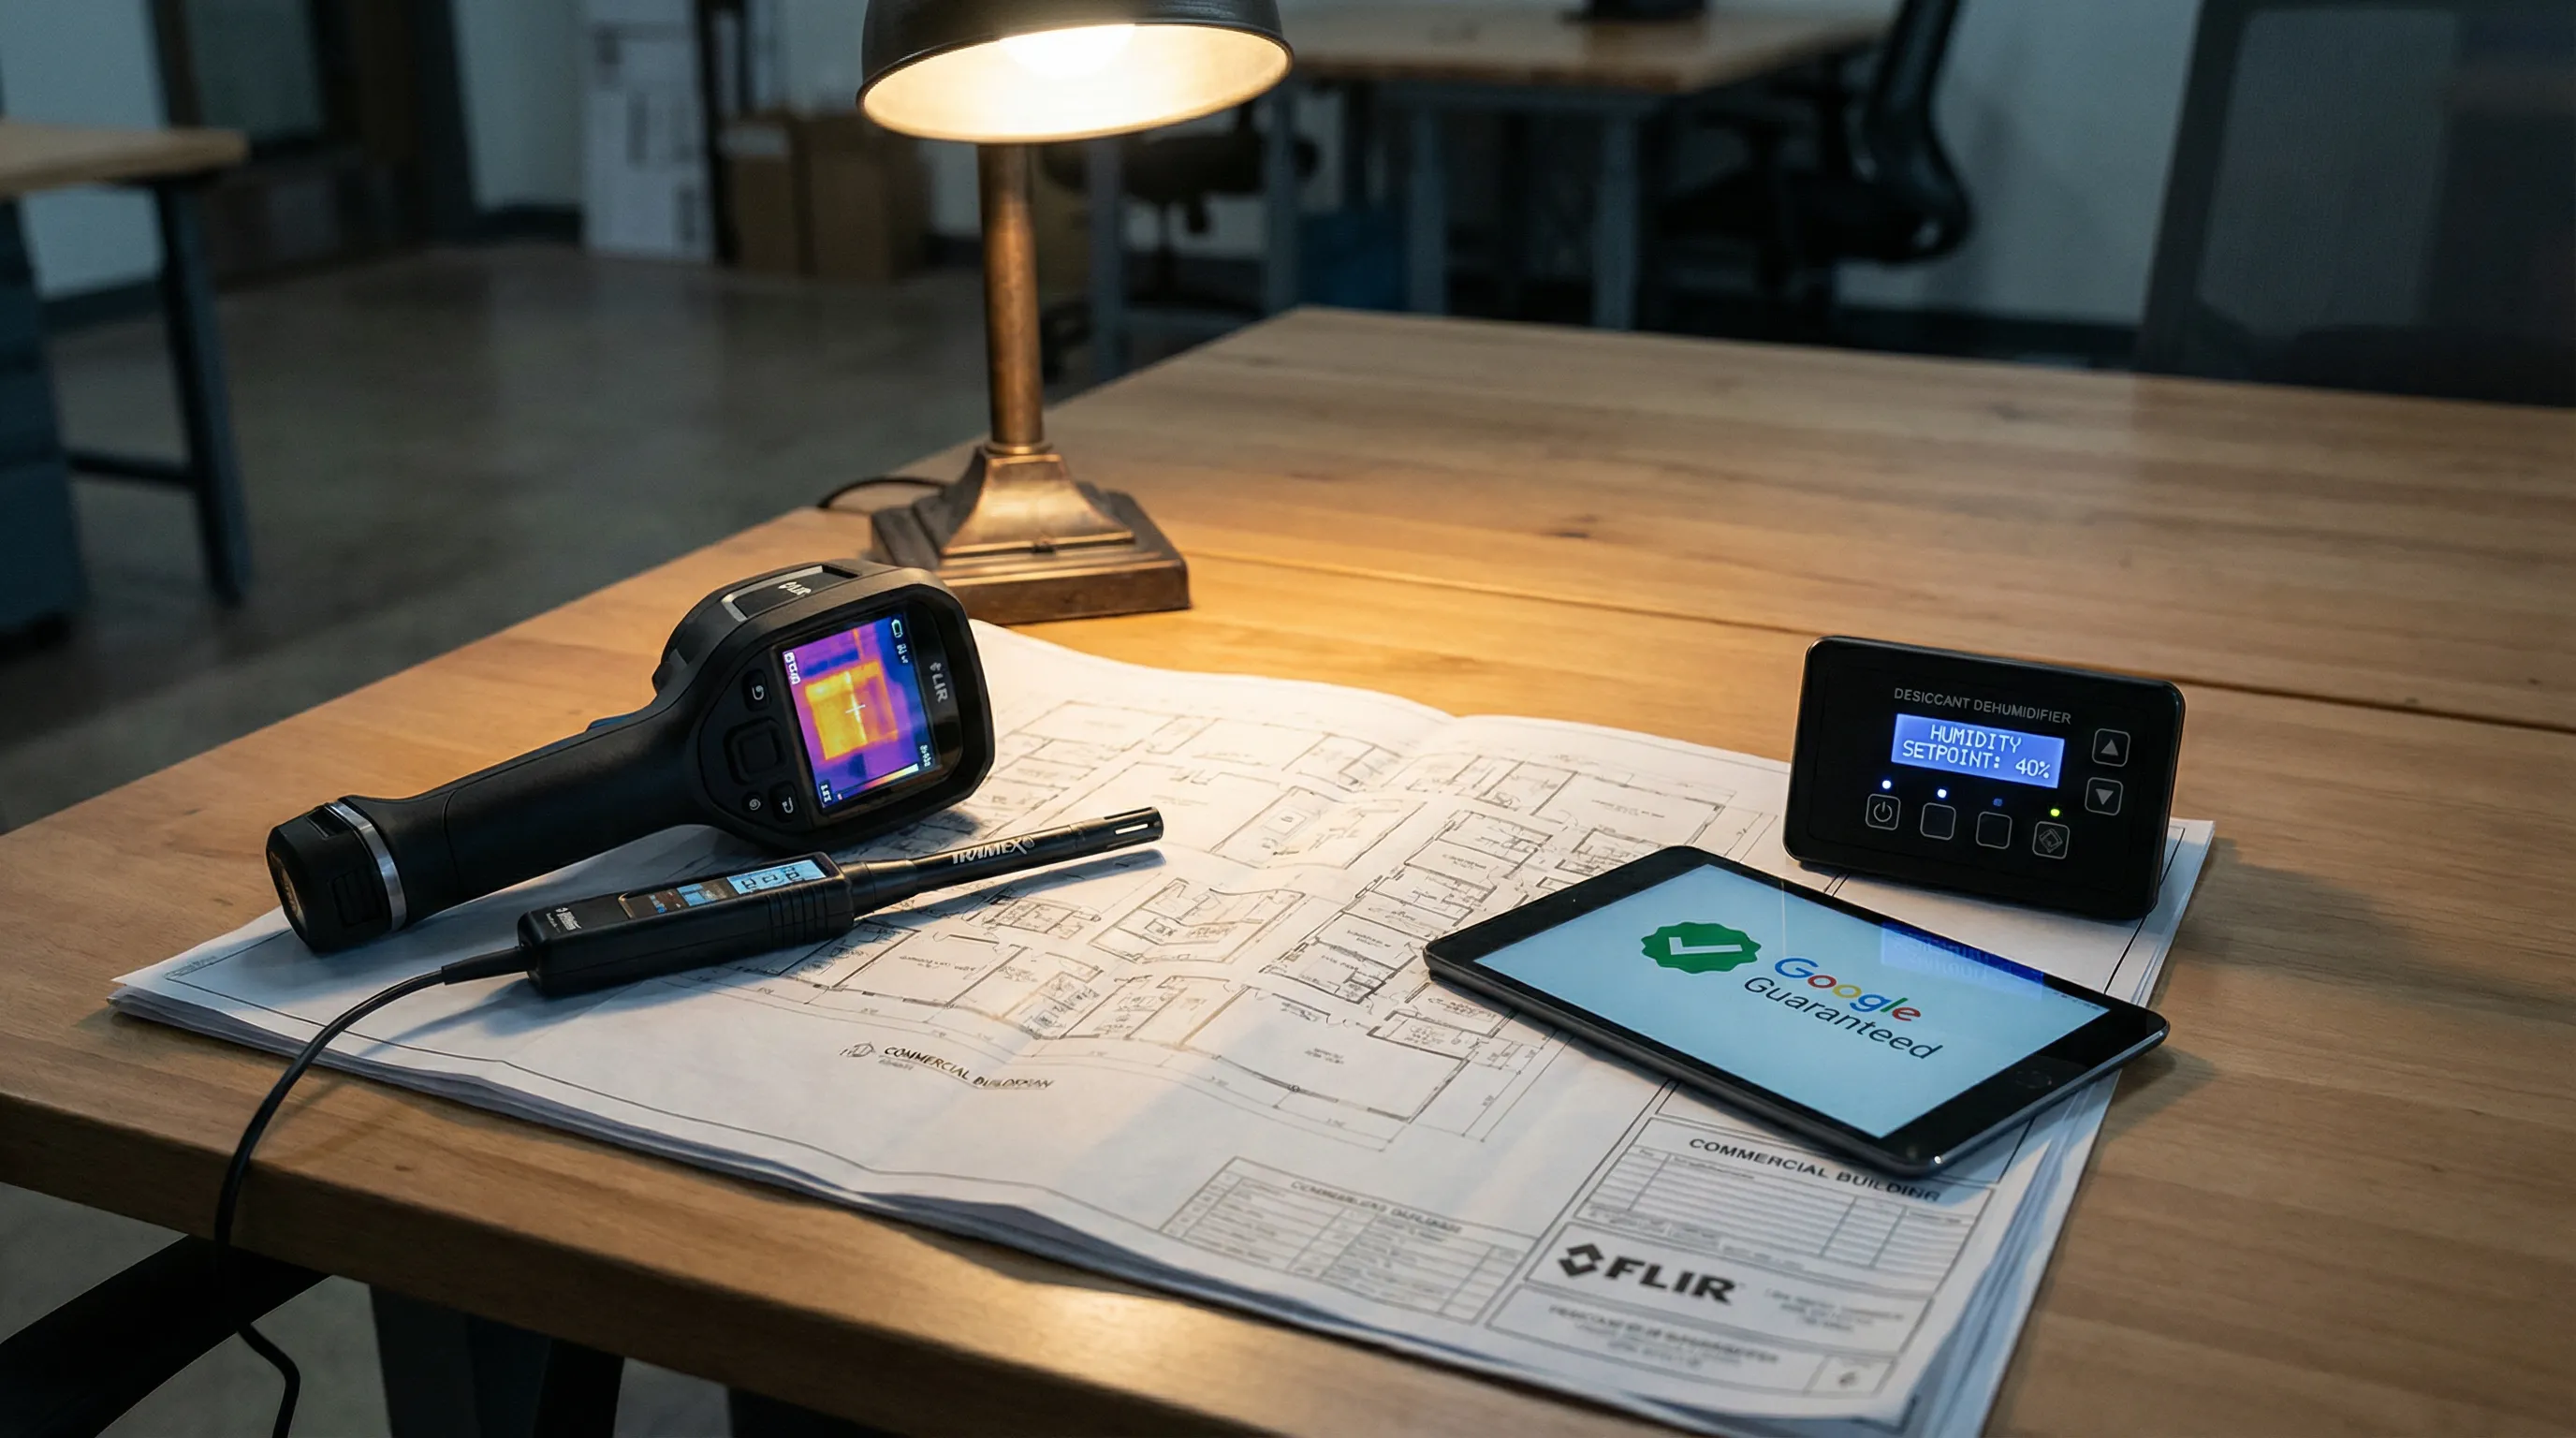
Local Services Ads Dominance
We optimize your Google Guaranteed profile, manage review velocity, and bid strategically to capture emergency searches in your service area. LSAs convert at 2-3x traditional search ads for restoration.
- Google Guaranteed optimization
- Review velocity management
- Service area bid strategy
- Call-only campaign integration
Speed-to-Lead Response
When someone searches 'water damage restoration near me' at 2am, they're calling the first company that answers. Our systems ensure instant call routing, automated SMS confirmation, and real-time lead alerts.
- Instant call routing
- SMS confirmation within 30 seconds
- After-hours live answering
- Technician dispatch alerts
Job Documentation & Close
We help implement systems that document damage, communicate with adjusters, and close jobs faster. Xactimate-ready documentation. Insurance liaison support.
- Photo documentation workflow
- Moisture mapping templates
- Adjuster communication
- Xactimate estimate support
The Metro Restoration Company
Scenario: A water/fire/mold restoration company in the Dallas-Fort Worth metro. 3 crews, primarily residential with some commercial. Current job volume: 15-20/month via referrals and TPA programs. Target: 30-40 jobs/month with reduced TPA reliance.
Monthly Funnel Target (at $10k ad spend)
Month 1-3 Ramp
- • $10k/mo ad spend + $3k management
- • Target: 40 emergency calls
- • Target: 20-25 additional jobs
- • Target: $100k-$125k additional revenue
Month 4-6 Scale
- • $20k/mo ad spend + $5.5k management
- • Target: 80 emergency calls
- • Target: 40-50 jobs/month
- • Target: $200k-$250k monthly revenue
Critical Success Factors
- • 24/7 Phone Coverage: If you don't answer in 5 minutes, they call the next contractor
- • Speed-to-Site: Target under 60 minutes—first responder wins ~70% of jobs
- • Full-Service Capability: Mitigation + Reconstruction = you keep the entire scope
- • Reduced TPA Reliance: Own your leads, restore your margins (target 30-50% self-generated)
Target 6-Month ROAS: 4-8x on total marketing investment, depending on job mix (water vs fire) and answer rate consistency. This assumes maintaining 24/7 coverage and adding a 4th crew by month 4 to handle increased volume.
DISCLAIMER: This is a hypothetical model based on industry benchmark targets. It does not represent guaranteed results or historical performance of a specific client. Individual results vary based on market conditions, crew capacity, 24/7 coverage, speed-to-site capability, and TPA/self-gen mix.